Search This Blog

Showing posts with label OBIEE 10g. Show all posts

Friday, 3 January 2014

All Oracle Certification Dumps

Hi All,

If you are trying to write any oracle related certifications and looking for dumps, Let me know. I know some peoples online who gives dumps in very low rate.

Cheers!
Bose

Thursday, 12 December 2013

Adding Database Hints to your reports to improve OBIEE performance

1. There is no option to add database hints at the presentation level (i.e. Answers), however, you can set 'hints' in the repository for each physical table. You can do this by opening up the properties of the physical table and entering the hint (without '/*' and ' */') in the "Hint" field.

If you need different hints on the same physical table, then you can create 'aliases' of the physical table and model them separately.

2. In the connection pool, you can issue an 'ALTER SESSION' command to change a database parameter on log in.

3. You can use the 'Direct Database Request' functionality. That way, a user with the appropriate privileges can construct the request using SQL, and you can add hints to the SQL.  The drawback of this solution is that any user that needs to run the request will need to be granted the "Execute Direct Database Requests" privilege in the OBI Presentation Server Catalog ('Administration > Manage Privileges > Answers'). Also, the OBI Server Metadata "Security Manager > Permissions > Query Limits > Execute Direct Database Requests" option must be set to 'Allow' as well.


Happy Blogging!
Cheers!
Bose 

Tuesday, 13 August 2013

Connecting Essbase with OBIEE 11g - A Complete Step by Step Guide

This post is containing a PDF document which best describes how to create an Essbase Cube that we could use for OBIEE Report.

This simple step by step explanation guide will help us to create the Essbase Cube, Importing the cube in OBIEE Administration Tool and creating the report based on the Base.

To download the document click here

Hope it helps!

Cheers!
Bose

Sunday, 14 April 2013

Types of Hierarchies in OBIEE 11g

OBIEE supports various kinds of hierarchies. OBIEE 10g support Level-based, value-based hierarchies but OBIEE 11g supports two more hierarchies. Here is the definition for that
Level-based Consists of one or more levels. For example, a Time hierarchy might have levels for Year, Quarter, and Month.
Value-based Consists of values that define the hierarchy, rather than levels. For example, an Employee hierarchy might have no levels, but instead have names of employees who are managed by other employees. Employees can have titles, such as Vice President. Vice Presidents might report to other Vice Presidents and different Vice Presidents can be at different depths in the hierarchy.
Ragged A hierarchy in which all the lower-level members do not have the same depth. For example, a Time hierarchy might have data for the current month at the day level, the previous month’s data at the month level, and the previous 5 years’ data at the quarter level. This is also known as an unbalanced hierarchy.
Skip-level A hierarchy in which certain members do not have values for certain higher levels. For example, in the United States, the city of Washington in the District of Columbia does not belong to a state. The expectation is that users can still navigate from the country level (United States) to Washington and below without the need for a state.

Friday, 25 January 2013

More than 4000 Character in OBIEE


Recently I have come across throught the business requirement where the backe end databae SQL server is having some dimensional columns in a table which is having around 15000 character. As per the business need I need to show the same value in BI Dashboard.

But as we know OBIEE repository is having 3 types of Character types and max size of the datatype is 4000

1. VARCHAR
2. BINARY VARCHAR
3. LONGVARCHAR

If values exceed more than 4000 character in a columns It  does not show the value in the OBIEE answers/Dashboards but the interesting fact is OBIEE VARCHAR column support to the max size of 8000

So here is the workaround:

Step1:
Right click on the particular column in the physical layer of the repository and select 'Properties' and set LONGVARCHAR as data type and set '32768' as size

Step2:
Use the substring function the split the value in the column. So here my columns is having around 15000 character so I am splitting first 8000 character into one column and another 7000 character to another column.

Here keep two things in Minds.

First we need to cast the column to change LONGVARCHAR to VARCHAR and then use SUBSTRING to split the values

For e.g:

Original Column:
BAW."Dim - Product"."Sales Comment"
Sales Comment1 : Which will be holding the value of first 8000 character 

CAST ( SUBSTRING(BAW."Dim - Product"."Sales Comment" FROM 0 FOR 8000) AS VARCHAR ( 8000 ))

Sales Comment2: which will be holding the value of another 8000 character
 CAST ( SUBSTRING(BAW."Dim - Product"."Sales Comment" FROM 8000 FOR 16000) AS VARCHAR ( 8000 )) 

Step3: 
Drag the newly created columns into the corresponding presentation tables in presentation layer.

Step4: 
Reload the metadata repositoy in OBIEE answers side and check with the newly imported columns in results.

Note:
If you need both values in a single column result, try to use the narrative view methods.

Cool... isn't it???!!!

Cheers!
Bose

Tuesday, 1 January 2013

Important OBIEE Interview Questions

Q1. Tell me about you and your technical expertise.
      Ans: your personal details, with studies job experience and highlighting the projects 
      and your technical skills

Q2. Which versions of OBI/ Siebel Analytics you have worked in?

Q3.Have you worked in Informatica? Which version

Q4. Explain me about your recent Project?
      Ans: Explain the Domain of the Project, Company from which you have worked in             that project, who is the Client, Technologies used in this application like OS,             
      Database,  OBI, Source Application (Mention as Siebel CRM)

Q5. Have you worked on OBIEE or OBIA?
Ans: OBIA

Q6.What is OBIA?

Q7.What is OBAW?

Q8.What is the Components of OBIEE and OBIA?

Q9.What is the Difference in OBIEE and OBIA?

Q10. Explain the Architecture of OBIA?

Q11. Explain the architecture of OBIEE?

Q12. What have you done in RPD?

Q13. What have you done in Reports what kind of reports / views you have worked in

Q14. Explain about one of the complex situation you have faced in your project and how          did you solve that. (While answering Provide Example)

Q15. What is Connection Pool?(While answering Provide Example)

Q16. What do you mean by Shared Log On option in the Connection Pool?(While answering         Provide Example)

Q17. How do you create a DSN?

Q18. RPD UserID and Password and Connection Pool user ID Password are usually same or            different? Why? (While answering Provide Example)

Q19. What are the Physical Layer Objects?

Q20. Why do you need to create an Alias? (While answering Provide Example)

Q30. How do you create a view in the Physical Layer of RPD? (While answering Provide            Example)

Q31. How many Layers are there in the RPD?

Q32. What is the Use of BMM Layer? (While answering Provide Example)

Q33. What is the Use of RPD? (While answering Provide Example)

Q34. What is the use of Presentation Catalogue? (While answering Provide Example)

Q35. RPD is Holds Data or Metadata?

Q36. What is the use of Config.INI File (While answering Provide Example?)

Q37. Where is this file located? (While answering Provide Example)

Q38. Where is the Presentation Catalogue located (While answering Provide Example?)

Q39. How do you enable Cache (While answering Provide Example?)

Q40. What are the other properties that you can set in the Config File (While answering Provide Example)

Q41. Where is Instance Config.xml located and what is the use of this File(While answering Provide Example)

Q42. What is Cache Persistence? Where do you set that? (While answering Provide Example)

Q43. How do you make a table "Cacheable" (While answering Provide Example?)

Q44. Suppose In the Config file I have enabled the Cache still cache is Not generating what could be the possible reason?(While answering Provide Example)

Q45. Based on What criteria or situation a report / query will hit the cache? (While answering Provide Example)

Q46. What do you understand by Cache? (While answering Provide Example)

Q47. What is a Fact Table? (While answering Provide Example)

Q48. What is a dimension table? (While answering Provide Example)

Q49. What is Measure? (While answering Provide Example)

Q50. What is Attribute? (While answering Provide Example)

Q51. What is star schema? (While answering Provide Example)

Q52. What is snowflake Schema? (While answering Provide Example)

Q53. What are the Difference BW OLTP and OLAP? (While answering Provide Example)

Q54. What is Normalized and what is De-normalized? (While answering Provide Example)

Q55. Why the Fact is on the many side and Dimension is at the One Side of a star schema (While answering Provide Example)

Q56. How many LTS can a logical table have? (While answering Provide Example)

Q57. How many Physical Sources a LTS can have? (While answering Provide Example)

Q58. In which scenario you will have more than one logical table source under one logical table? (While answering Provide Example)

Q59. Under which scenario you will have one LTS and More than one Physical Sources inside that? (While answering Provide Example)

Q60. Why do we need to create a complex/logical join in the BMM layer? (While answering Provide Example)

Q61. What is the difference b/w Logical join and Physical Join?(While answering Provide Example)

Q62. One Logical Column can be mapped to how many Physical Columns? (While answering Provide Example)

Q63. One Logical Column can be mapped to how many logical columns? (While answering Provide Example)

Q64. If you create a Logical column based on an existing logical Column, and a similar column based on two physical columns what would be the difference? (While answering Provide Example)

Q65. How do you create a calculated measure? (While answering Provide Example)

Q66. How do you create Dimension Hierarchy? Tell all the steps(While answering Provide Example)

Q67. Why Dim Hierarchy is required? (While answering Provide Example)

Q68. What do you understand about content level of a Fact Table? (While answering Provide Example)

Q69. What do you understand about Granularity of a fact and Dimension table? (While answering Provide Example)

Q70. What is the Significance of providing the content specification in the Fact Table? (While answering Provide Example)

Q71. How do you implement Aggregate Fact Table? (While answering Provide Example) provide all the steps

Q72. Why do we need to use Aggregate table? (While answering Provide Example)

Q73. While implementing aggregate table how many LTS will be there in the logical table? (While answering Provide Example)

Q74. One presentation catalogue can be mapped to how many Business Model? (While answering Provide Example)

Q75. One How many Presentation catalogue can be mapped to one Business Model.(While answering Provide Example)

Q76. How many Types of variables are present ? (While answering Provide Example)

Q77. What is the use of Each Type of Variable? (While answering Provide Example)

Q78. What is a Initialization Block? (While answering Provide Example)

Q79. What is a Row Wise Initialization block? (While answering Provide Example)

Q80. What is a Level Based Measure? (While answering Provide Example)

Q81. What is the use of a Level Based Measure? (While answering Provide Example)

Q82. How do you create Level Based Measure? (While answering Provide Example)

Q83. I want to create the Following Measure Explain how you will do that.
     # of SR closed in last 14 Days. (While answering Provide Example)

Q84. Want to create a measure.
     # Of SR Closed Till Date (While answering Provide Example)

Q85. What is the Time Series Function? How to use Time Series Function. (While answering Provide Example)

Q86. How to create following measure?
     # of SR Closed Monthly / No of SR Closed Total

Q87. What is Fragmentation Content? (While answering Provide Example)

Q88. What is Where Clause Filter? Where do you apply such filter? Why do you apply such filter? (While answering Provide Example)

Q89. What is Authentication? What is Authorization? (While answering Provide Example)

Q90. How many type of Authentication are present? (While answering Provide Example)

Q91. What do you mean by Database authentication? (While answering Provide Example)

Q92. What do you mean by External Table authentication? (While answering Provide Example)

Q93. How do you authenticate the users using the variables? What kind of variable you use for this purpose (While answering Provide Example)

Q94. What is the Difference between Non system Session Variable and Dynamic Repository Variable?(While answering Provide Example)

Q95. How do you provide access to different Subject Areas? (While answering Provide Example)

Q96. Can a Group be member of another Group? (While answering Provide Example)

Q97. Suppose a User U1 is member of a Group1. Group1 has access to Subject Area A1. Group1 Does not have access to Subject Area A2, Group1 is member of Group2. Group2 has no Access for Subject Area A2 , but has Access for Subject Area Sa3.
User U1 will have access to which subject Areas? Question from Group Inheritance (While answering Provide Example)

Q98. Want to replace the Null Values as 0 for the Measure Sales Value? How would you do that?(While answering Provide Example)

Q99.What is the difference between Pivot and Tabular report?(While answering Provide Example)

Q100. Why do we need exclude column option in Pivot report? (While answering Provide Example)

Q101. What is section in a pivot table report? (While answering Provide Example)

Q.102 what is Pages in a pivot table report? (While answering Provide Example)

Q103. What is calculated item in a pivot table report (While answering Provide Example?)

Q104. What is conditional formatting (While answering Provide Example)

Q105.  I want to compare if actual is greater than the target then we need to highlight the sales rep column how to do this (While answering Provide Example)

Q106. What do you mean by Scope of a Dashboard prompt (While answering Provide Example?)

Q 107.  What is Dashboard prompt how to create dashboard prompt (While answering Provide Example)

Q108. Difference between Column selector and View Selector (While answering Provide Example)

Q109. What do you understand by Report Defaults in Dashboard prompt (While answering Provide Example?)

Q110. What is the difference between Dashboard prompt and Global Filter (While answering Provide Example?)

Q111. What is the Difference between dashboard Prompt and Report Prompt (While answering Provide Example)

Q112. How many Type of Graphs are supported in OBI (While answering Provide Example)

Q113. Can we navigate from graph how? (While answering Provide Example)

Q114. How do you navigate from report? (While answering Provide Example)

Q115. I have a parent report with Region and sales. Once i click on a particular Region                Value it should drill down to other report with Region and Pending order, for that               particular region I clicked on. How to achieve this? (While answering Provide Example)

Q116. What is the difference in Report prompt and dashboard prompt?  (While answering Provide Example)

Q117. What is guided navigation (While answering Provide Example?)

Q118. How to attach document in the Dashboard (While answering Provide Example)

Q119. How to Create Combined Request (While answering Provide Example)

Q120. How to use Filter based on another request (While answering Provide Example)

Q121. What is narrative view?


Q122. I want to remove the download to excel option in the dashboard Reports - how (While answering Provide Example)
 Edit Dashboard -> select Property of Report -> Select Report link -> uncheck the download option.

Q123. How to create dashboard?
 Settings -> Administration -> Manage Interactive Dashboard -> Create Dashboard -> Give the dashboard name and builder to create.

Q124. How to give access to the different dashboards to different groups (While answering Provide Example).
 Settings -> Administration -> Manage Interactive Dashboard -> Select Lock Symbol for the specific Dashboard and give access to the users.

Q125. How to deny Permission to use answers to a particular group. (While answering Provide Example)
 Settings -> Administration -> Managed Privileges -> Access -> Access to Answers

Cheers!
Bose

Saturday, 15 December 2012

Oracle / SQL Server Query for MTD (Month to Date), YTD (Year to Date), Rolling 12 Months, & Prior Year Sales

Recently I came across an interview and I had been asked for write an SQL Query from the table for Month To Date and Year To Date for sales amount from sales table.

Here is the synopsis:
If using Oracle use the trunc and numtoyminterval functions; if using SQL Server use the datediff function.
 
Oracle Month to Date:


SELECT sum(SALES_AMOUNT)
FROM SALES
WHERE DATEOFSALES BETWEEN trunc(sysdate, 'MONTH') and sysdate

Oracle Year to Date:


SELECT sum(SALES_AMOUNT)
FROM SALES
WHERE DATEOFSALES BETWEEN trunc(sysdate, 'YEAR') and sysdate

 
Oracle Rolling 12 Months:


select sum(SALES_AMOUNT)
FROM SALES
WHERE DATEOFSALES between trunc(sysdate - numtoyminterval(12, 'MONTH'),
 'MONTH') and sysdate

 
Oracle Prior Year:


SELECT sum(SALES_AMOUNT)
FROM SALES
WHERE trunc(DATEOFSALES, 'YEAR') = trunc(sysdate - numtoyminterval
(1, 'YEAR'), 'YEAR')

SQL Server Month to Date:


SELECT sum(SALES_AMOUNT)
FROM SALES
WHERE datediff(month, DATEOFSALES, getdate()) = 0
AND DATEOFSALES <= getdate()

 
SQL Server Year to Date:


SELECT sum(SALES_AMOUNT)
FROM SALES
WHERE datediff(year, DATEOFSALES, getdate()) = 0
AND DATEOFSALES <= getdate()

 
SQL Server Rolling 12 Months:


SELECT sum(SALES_AMOUNT)
FROM SALES
WHERE datediff(month, DATEOFSALES, getdate()) <= 12
AND DATEOFSALES <= getdate()

 
SQL Server Prior Year:


SELECT sum(SALES_AMOUNT)
FROM SALES
WHERE datediff(year, DATEOFSALES, getdate()) = 1


Hope it is useful.
Cheers!!!
Bose


Thursday, 22 March 2012

Generate Metadata Dictionary in OBIEE 10g

Generating Metadata dictionary is one of the added advantage in OBIEE.  This allows the End User know about the added information of each column like data type, length, nullable and etc., 
A metadata dictionary is a static set of XML documents. Each XML document describes a metadata object, such as a column, including its properties and relationships with other metadata objects.
Here we are going to know how to generate metadata in OBIEE 10g.

In this post I have taken samplesales repository to generate its corresponding metadata dictionary. I am suggesting you people to take which repository you really need to generate metadata dictionary.

Step1: 
Open BI Administration Tool in Offline Mode -> Select 'Tools' Menu -> From dropdown option Select 'Utilities'
Below is the sample screenshot:
Step2:
Once we clicked Utilities, It will show the Utilities Window. From there select 'Generate Metadata Dictionary' and click 'Execute'

Step3:
Create a folder called 'Metadata in D: Drive and choose that folder in the choose Directory Screen

Step4:
Once we selected the target folder and clicked 'OK' with the above screen, It will generate the metadata dictionary folder in the name of repository. This process will take time depend upon the repository size. Once it is created metadata dictionary folder we will get confirmation dialog box like below:

Step5: 
Now go the D:\Metadata folder. There we can see the samplesales folder which is generated just before. Copy the 'samplesales' folder to the below location;
C:\OracleBI\oc4j_bi\j2ee\home\applications\analytics\analytics\dictionary
Note: Commonly the dictionary folder will not be available in the analytics folder. So create 'dictionary' folder into the analytics folder and copy samplelsales folder into that folder.

Step6:
Now open the instanceconfig.xml file from the location C:\OralceBIData\web\Config. Once we opened the file add the below code inside into the <ServerInstance> tag.
<SubjectAreaMetadata>
<DictionaryURLPrefix>/analytics/dictionary/</DictionaryURLPrefix>
</SubjectAreaMetadata>
Step7:
Now restart the following BI Services to apply the changes.
1. Start OC4j
2. Oracle BI Server
3. Oracle BI Presentation Server
After the service restarted, Login into the BI Presentation services. We can see the metadata dictionary beside to subject area /columns. It is shown in the red rectangle in the below screenshot:
Step8:
Click on the 'Metadata Dictionary' symbol. Refer above screen to see the detail. It will display the screen like below. Using this we could know the information about all tables, columns and its details.

Note: Security Changes
Like all other report privileges we can restrict the users who needs to be accessed about this Metadata Dictionary by changing the privileges in Administration -> Access -> Acces to Metadata Dictionary in Presentation Services Administration settings.
Cheers!
Bose

Monday, 19 March 2012

Excel as Data Source in OBIEE

We know that OBIEE is supporting for a wide variety of database to use. Sometimes we are having an requirement How to use Excel as datasource. Here I am sharing How to import tables into the physical layer of Administration Tool which we are having in excel file.
First we have to create sample Excel data with ".xls" format. Below is the sample screenshot of three tables which we have created in one excel in three separate tab. 


Go to Control Panel -> Administrative Tool -> Data Sources (ODBC) -> Select 'System DSN' Tab. From there click 'Add' Button. We will get 'Create New Data Source' window. From the window select 'Microsoft Excel Driver(*.xls)'
From the above screen Click 'Finish' Button. We will get 'ODBC Microsoft Excel Setup' screen
Click on 'Select Workbook' button.  Now we are in 'Select Workbook' Screen. Here I have selected the excel file which We have created just before.

we have selected my source excel file which we have created and saved in D drive. The above screen we are showing 'Read Only' option which will not allow the user to change the data when the Oracle BI Server is running with excel source file.
If we want to change the data in this excel while 'Oracle BI Servier' is running, we have to uncheck this 'Read Only' option. 
So once we have selected the source excel file and setup with the option click 'OK' button with above screen. Give the Data source Name with the below screen and give description (optional) if you want and Click 'OK'
Now we can view the DSN 'BISAMPLE' in  System DSN tab in ODBC Data Source Administrator.
Now Open the Administration Tool and go to File -> Import -> Import from Database. Select 'Data Source; Screen will appear. from there leave Connection Type to 'ODBC 3.5' and select  BISAMPLE. No UserName and Password is required. Just Click 'OK'
Once we clicked 'OK' with the above screen we are coming to import screen. From there select 'System tables' Option. It will show all the tables what we have created in the separate tab of an excel.
Click 'Import' with the above screen. Now we can view all the tables in the physical layer of the rpd. Update the row count to check the data.
All other steps are same which we are following for all other Data sources. Now we can make physical diagram all other BMM Layer and Presentation Layer work and can create some report with answers
Points to Remember:
1. For Demo purpose If you need to create some application, we can go for  
   this type of data source.
2. For huge number of tables, data sets this methods is not good enough
3. If the data volume is increasing in Day by Day, or Month Wise then do not 
    follow this method.
4. If you are having static data which will not change for a year or a long
    period then go for this type method

Time Series functions in OBIEE

Scenario: 
In Sales business, The sales manager want to see the sales data for one month ago, one year ago or from some amount of time to current date or starting from a period and ending in another period they want to calculate the sales amount. How will you do that?
Yes, Absolutely Time series functions providing the way to make the comparison between the time to calculate a measure because SQL is not providing any direct way to make time comparisons. So by using Time series function we can calculate a measure for the above explained requirements. 
Note: Before going to use the time series functions we have to create Time Dimension hierarchy first.
We are creating a measure using time series functions in BMM Layer of Administration tool.
In OBIEE 10g we are having two time series functions
1. Ago( )
2. ToDate( )


1. Ago( )
    This function calculates aggregated value for a measure as of some time period ( a month 
    ago, or a year ago) from the current time. This function is passing three parameters.
        Syntax: Ago(<<Measure>>, <<Level>>, <<Number of Periods>>) 
     i. Measure: A measure column which you to make use in this function 
    ii. Level : On which level you want to calculate this measure. This level is selected from 
        the Time Dimension hierarchy
   iii. Number of Period: A numerical value which will go for how many level 
        you want to go before from current time.
        E.g.: Ago("SH"."SALES"."AMOUNT_SOLD" ,  "SH"."Time Dimension"."Month" , 1) 
        In the above example I have created a Column called 'Sales Month Ago' using Ago() 
        function.


2. ToDate(  )
     This function aggregates a measure from a beginning of a specified time  period to the 
     currently displayed time. We can create a calculated column using this function by 
     following the same procedure how we have created a column using 'Ago' function.
     Syntax: ToDate(<<Measure>>, <<Level>>) 
     For e.g: ToDate("SH"."SALES"."AMOUNT_SOLD" ,  "SH"."Time Dimension"."Year" ) 
     With the above example 'Amount Sold' Column is the measure and 'Year' is the level 
     Which will calculated the measure  from the beginning of the year to a specified time.


In OBIEE11g with the above function there is one more function has been added


3. PeriodRolling( )
    This function allow us to create a aggregated measure across a specified set of query   
    grain period, rather than within a fixed time series grain. The common use of this 
    function is to create a Rolling Average such '10-Week Rolling Average'


Syntax: PeriodRolling(<<Measure>>, <<Starting Period Offset>>, <<Ending Period Offset>>)
     Measure: represents the logical measure column from which you want to derive.
     Starting Period Offset: identify the first period used in the rolling aggregation.
     Ending Period Offset: Identify the last period used in the rolling aggregation.
     For e.g: PeriodRolling( "SH"."SALES"."AMOUNT_SOLD", -2, 0)
    With the above example I'm creating three months rolling sum of  column 'Amount Sold'. It 
    includes past two months with the current month.
    The numerical value '-2' in the offset indicates the month Jan-12, Feb-12 if our current   
    month is 'Mar-12' The numerical value '0' in the offset indicates the Current Month
Note:
PeriodRolling( ) function which will not the calculate the Average sum of three months for the measure. Average (AVG( ) function in OBIEE) computes the average of the database rows accessed at the storage grain. So If you want to calculate the 3-Month sales average for the above explained Period Rolling example we have to write the syntax like below:
3-Month Sales Average = 
(PeriodRolling( "SH"."SALES"."AMOUNT_SOLD", -2, 0) )/3


Happy Blogging, 
Bose

Saturday, 17 March 2012

FMAP in OBIEE 10g & OBIEE 11g

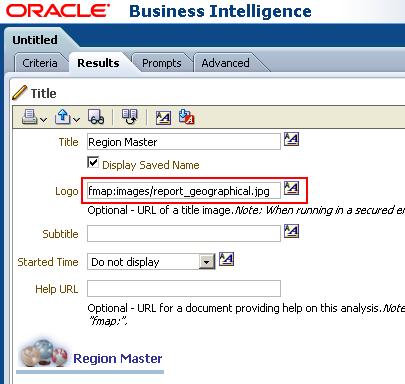
Using fmap syntax we can add images to the dashboard that is stored in the Oracle Business Intelligence Environment. So If want to use any image like logo with a saved request / dashboard in OBIEE 10g or with any analysis/dashboard in OBIEE 11g we can use fmap.


Syntax: fmap:images/imagename.imageformat
for e.g: fmap:images/regport_geographical.jpg


The syntax is same for 10g and 11g.
We can find the images from the below path in 10g and 11g. As per your working BI version you can browse the corresponding folder and select the image and can use the same image in your saved request or analysis.


OBIEE 10g Path:
In OBIEE 10g the images are located in two places.
If you want show any of your custom images then you have to add that images into the below mentioned paths and can use the same images with fmap syntax.


1.C:\OracleBI\oc4j_bi\j2ee\home\applications\analytics\analytics\res\s_oracle10\   
   images
     (and)
2. C:\OracleBI\web\app\res\s_oracle10\images


OBIEE 11g Path:
If you want to show any of your custom image then you have to add that image into the below mentioned paths and can use the same images with fmap syntax.
1. C:\OBIEE11g\Oracle_BI1\bifoundation\web\app\res\s_blafp\images
      (and)
2. C:\OBIEE11g\user_projects\domains\bifoundation_domain\servers\bi_server1\    
    tmp\_WL_user\analytics_11.1.1\7dezjl\war\res\s_blafp\images


OBIEE 11g fmap Syntax screenshot for sample image in Title View:

OBIEE 11g fmap Syntax screenshot for sample image in an Analysis:


Hope it helps!
Bose

What is Oracle Database Link and How to create database link (DB Link)

 https://www.oracletutorial.com/oracle-administration/oracle-create-database-link/

Recent Posts