Search This Blog

Thursday 26 April 2012

'No Results' View in BI 11.1.1.6.0

In BI 10g, we are having separate view called 'No Results' to display the custom Message if the specified criteria or conditions is not meeting.

 For Example I am taking simple Product, Product Type, Revenue from sample sales. I am displaying only top 10 products in my report and filter 'Product' is having all the types. So If we are selecting any product which is not in the report, It will give empty layout. Instead of Empty layout we can replace with view with some custom message using 'No Results' View.

How do you use 'No Results' in BI 11g? So here I am giving how I have created no results for sample report.

Step1: 
Login into the presentation services and select New -> Analysis -> select Subject Are 'Sample Sales Lite' and select Product, Product Type from Product Dimension folder and Revenue from Base facts Fact table from Subject Area.
After that Click Filter from product Column properties and select some products for sample and save it in any name. 
Before saving the report click on 'Edit Analysis Properties' in the criteria tab (Screen1). Refer the below screenshot or Click 'Edit Analysis Properties' in the Results tab (screen1)


Step2: 
Once we clicked on 'Edit Analysis Properties', we will get Analysis Properties window. In this window in 'Result Display' tab select 'Display Custom Message' instead of Display Default Message in No Results settings and write your own comment in 'Message' Space which we need to display in the report and Click 'OK' and save the report.


Step3:
Now come to the Dashboard. I am displaying the Product filter and the report which we have created just above. It is display the report for the products which we have added in the filter.
Now select any Product from filter which is not in the report and click 'Apply' in the prompt. It will display the 'No Results' view with the same message what we have created.

Cheers!
Bose

Friday 20 April 2012

Upgrade RCU Schemas to 11.1.1.6.0 in Oracle

Recently I have come through the Patch Upgradation from OBIEE 11.1.1.5.0 to 11.1.1.6.0. For a caues, before running Patch set assistant to upgrade the RCU schema from older version to latest, I have taken the back up of two database schemas (DEV_MDS, DEV_BIPLATFORM) to a Dump file.


Here I am sharing what are all the tasks I have done before running Upgrade Patch Assistant


Step1:
Make your Oracle database is up and running and the schema we want to upgrade are at version that are supported to upgrade. that is It must be older version from the version we are going to upgrade.


Login into oracle with 'SYS' account in sqlplus and type the below command to know the current version of RCU Schema and Its owner name.


SQL> SELECT OWNER, VERSION, STATUS, UPGRADED FROM SCHEMA_VERSION_REGISTRY;


So in my case the version 11.1.1.5 going to be upgraded to 11.1.1.6.


Step2:
we have to recompile the database objects before running Patch Set Assistant to check for invalid objects before the upgrade. with oracle database installation a .sql script file is coming default to recompile the database objects. The file is utlrp.sql and available in the below oracle installed path:
D:\app\Bose\product\11.1.0\db_1\RDBMS\ADMIN
So run this script file to recompile the database objects for validation by entering the command like below in sql.


SQL> @?RDBMS/ADMIN/utlrp.sql
 After execution of the script we will get screen like below:
Step3:

After running utlrp.sql, and before you upgrade your schema, issue the following query to ensure there are no longer any invalid database objects:


SQL> SELECT OWNER, OBJECT_NAME FROM ALL_OBJECTS WHERE STATUS='INVALID';
So we are not having any invalid objects in our database. Now we are ready to Patch Set Assistant. But if we are running the same query with status='VALID', We will come to know the valid database objects.


Step4: 
For a cause I have exported RCU schema to separate dumps .To export the database go to Run->type 'cmd'. The command prompt utility will be opened:
Execute the below command one by one to export both schema:


C:\> EXP DEV_MDS/Admin123 file=RCU_MDS.dmp log=mds.log


C:\> EXP DEV_BIPLATFORM/Admin123 file=RCU_BIPLATFORM.dmp log=biplatform.log
Now come to Drive where we are running the export command. We will get two dump files RCU_MDS, RCU_BIPLATFORM. Cut and paste in some other drive for a record.


Step5:
Now come to the below path and double click on psa.bat batch file. It will open GUI called 'Oracle Fusion Middleware Patch Set Assistant'. 


Drive:<BIHome>\oracle_common\bin\psa.bat


Follow the steps one by one with the above screen to upgrade the RCU Schema.
Patch Set Assistant Screens:


Cheers!
Bose

Friday 13 April 2012

Browser is not supported by Oracle Presentation services

Recently We have installed OBIEE 11.1.1.6.0 in one of our windows server environment. After successful installation It was opened Presentation Services with the message "Your Browser is not supported by Oracle Presentation Services"

According to the Latest Oracle Certification Matrix 11gR1 (11.1.1.3+) it supports "Internet Explorer 7.x, Internet Explorer 8.x and .Firefox 3.5+".
If you want to know in detail download certification matrix from here

If we are having the supported version of browsers than we are not getting any issue like this. but if we are not having the same supportable version and want to work with the same version then here is work around which I have resolved in my firefox browser.

The below screen which I got after installation of BI 11g
Before starting the work around, Ensure that you are having Administrator privileges so that I will not block anything.

Open your firefox browser and type "about:config" in the address bar and click 'Enter' button. we will get the screen like below. Click "I'll be careful, I Promise" button from below screen


 The next screen will show all the configuration details about the browser. Just right click on the screen and select New-> String
Once we selected String we will get small dialog box which will ask for the new configuration string which we are going to add. Give the name "general.useragent.override" and click OK. Next It will ask for the value of the string. Give the value "Mozilla/5.0 (Windows; Windows NT 6.1; rv:10.0)Gecko/20100101 Firefox/9.0" and click OK.
Now we can see the new configuration agent has been added in the browser configuration details. The main job of this agent is override the existing version to the mentioned value which we have given.
Now 'Refresh' the browser.It will open the Presentation Services.

Cheers!
Bose

Sunday 8 April 2012

Working with BI Publisher 11g - Part3 - Creating a Report

In this post, we learn to create a report using the Data Model which we have created in the Previous Post. So we can this post a continuation of previous post. We are going to learn How to create a report step by step. So Login into BI Publisher and follow the steps and Do not log out from the window to ask to do so.
Step1:
Once we logged into the BI Publisher click Report from create tab of left side pane or click New -> Report. Refer below screenshot 


Step2:
Select 'Use Existing Data Model' to use the data model to create the report

Step3:
Select the 'Sample_Employee_DM' data model which we have created in the previous session. and click 'Next'


Step4:
Once we selected the data model we will get two options to use
   i. Guide Me -> Which is having further few more steps to create the report
  ii. Using Report Editor -> Which will take the select data model and will give the 
Select 'Guide Me' and click Next
Step5: 
select the data model columns from the left side pane and click Next


Step6:
In this step save the report with the name 'Employee Report' in the 'Reports' folder inside the 'Publisher' folder. and click Save

Step7:
In the next step select  'View Report' and click 'Finish'

Step8:
Once we clicked 'Finish' with the above step It will open the report in the default layout with table data format. We can ascend, descend or filter the reports by clicking on the column header. We can see the Department Name as a prompt in the report. 
Step9:
Click properties and click 'Edit Layout' with the above step. We will get the report in the layout editor with the default table data format.


Step9:
Just select all columns and data of this default data table format and delete it. Now empty space will be available. Click on 'Layout Grid' and insert 2X2 rows and columns
We will get the below screen

Step10: 
Now click on the first grid in the layout and insert the Bar chart into that grid and drag the department name column from data model to bar chart series label and drag the salary column into the value labels in the bar chart. 
Now apply the summation average to see the average salary of total employees by department wise.
Step11:
Now select the second grid in the first row of the layout and insert a pie chart with ring type and drag the department name and salary in series label and value label respectively.
Now the layout is ready with two chart report. In the pie chart apply percentage from summation. so the pie chart will represent the percentage of salary by department wise.


Step12:
Now select second row from the layout. select two columns from second row and merge that into a single row. Now select 'Data Table' from insert table and drag into the second row of the layout.
 Now drag Department name, employee name, hire data, salary from data model into that data table.

Step13:
select Department Name column and click 'Grouping' option and select above. So the department column will come like prompt above the table report. 
Select 'Hire Date' column and click Data formatting option. There we will get various option to select. Select any particular type of date which you want to display in the data format.

Step14:
Now select Salary column and click Data formatting, there we will get various option like thousand separator, currency symbol, decimal point and etc., So apply the formats which you want to do with the salary columns.


Step15:
From conditional formatting we can apply the conditions same like when we are creating an analysis with presentation columns in a subject area. So here I have applied the conditional formatting in salary which will give red back ground when salary is less than or equal to $4999, and will show yellow background when salary between $5000 to $9999 and will show green background when salary is greater that or equal to $10000


Step16:
Apply save after every bit of work has done. grid layout into above and below the reports to apply a header and footer. So after inserted a single row with two columns above the chart insert two data labels into the columns and Double click into the label to give the name of the charts. 


Step17:
Insert layout grid with single row with three column below the table report and insert a data label into each column.Now apply page elements into the footer like page number, time, date. Finally save the report and select 'PDF' format from the various format which is available in the list.
Now we will get the report like below screen which is showing 'Employee Salary Analysis' report with two charts and one data table.


Showing the reports into Interactive Dashboard:
We can add the BI Publisher reports into the dashboard. For this we need to edit the dashboard page and select the publisher report from saved folder and drag into the dashboard page where we want to display the report. Save and run the dashboard. We can see the publisher report into the dashboard.

Saturday 7 April 2012

Working with BI Publisher 11g - Part2 - Creating Data Model

Introduction:
In this Post we will know how to create the sample Data Model with the DSN 'OE' which we have created in Data Sources in the previous post Create Data Source


In release of OBIEE 11g, Oracle BI Publisher introduces the Data Model Editor, a graphical user interface for building data models within the BI Publisher interface. It enables us to perform the following tasks:
  • Create Data Sets - Access data from a wide range of sources: RDBMS, OLAP, WebServices, BI Analyses, XML files, Excel and others.
  • Query data - Build SQL or MDX queries to extract data from relational or multidimensional (OLAP) data sources.
  • Structure data - Define master-detail relationships between data sets to group data at multiple levels to optimize document generation.
  • Aggregate data - Create group level totals and subtotals.
  • Customize data - Modify data field names to conform to business terms and reporting requirements.
  • Create calculations - Compute data values that are not stored in the underlying data sources that are required for reporting.
  • Advanced tasks - Define parameters and lists of values (LOV), triggers, and other advanced elements as required by reports and report users.
Here will learn how to create Data Model based on SQL query using the JDBC connection you defined in the previous post. Also, we will learn how to add parameters and LOVs to the data model. 


Creating Publisher Folder:
Before going to create a new Data Model, Create a your own folder to save your Publisher Related work.
Come to 'Home' Page of BI Publisher and click Catalog' Link and select 'Shared Folder' in the left side of catalog tab. Now Click 'New' under catalog tab and select 'Folder'
Folder 'Create' window open. Create New folder name 'Publisher' click 'Create'
 New 'Publisher' folder has been created and shown in the right side of catalog tab.


Creating New Data Model:
Step1: There are multiple ways to create  a Data Model. Create a Data Model by following any of the below method:


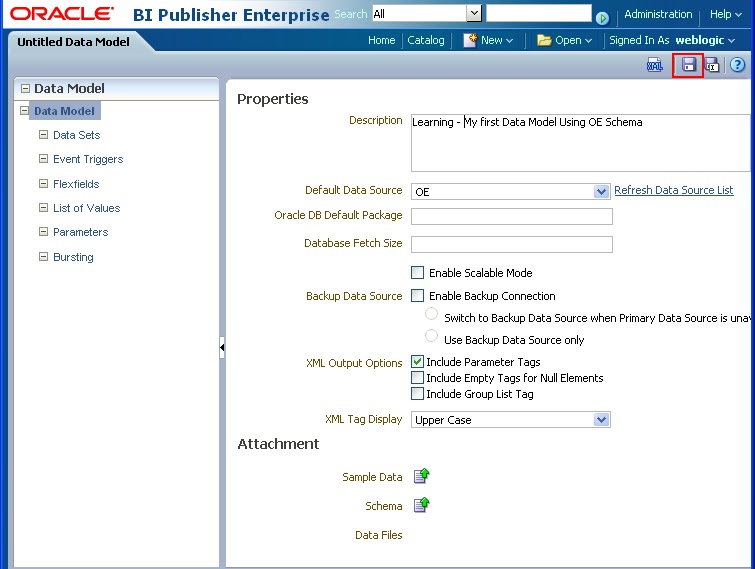
Step2: Once we clicked on the Data Model we will get 'Untitled Data Model' window. Select 'OE' from Default Data Source and Optionally add description if you want to add.
Make sure in the XML Output Options, the Include Parameter Tags is checked, and the Include Empty Tags for Null Elements, and Include Group List Tag check boxes are not checked. Check the below screenshot for your reference:
Step3: Save the Data Model by clicking save button which is available in the right upper corner. I have saved in the folder 'Publisher' which we have created for publisher report purpose in the name of 'sample_Employee_DM'.
Step4: After saved the Data Model is displaying with the name sample_Employee_DM instead of Untitled Data Model. Now we have set all the properties of the Data Model.
Click on 'Data Sets' which is available below Data Model in the left pane. Once we selected Data Sets, the right pane will show three tabs such as Diagram, Structure, Code.
Select structure tab -> Click New Data Set -> Select SQL Query as shown like below screenshot:
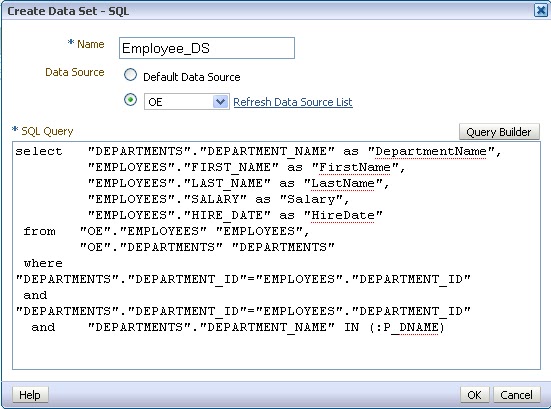
Step5: Once we clicked 'SQL Query' with the above steps it will open 'Create Data Sets- SQL' window. From that window Select 'OE' in the Data Source and Click 'Query Builder
Step6: Query Builder screen is appearing now and it is showing the 'OE' schema objects in the left pane of that screen. 


Drag DEPARTMENTS and EMPLOYEES to the Model space in the right side pane and make a join between those tables by clicking the empty box which is available beside DEPARTMENT_ID column in the department table and clicking empty box available beside DEPARTMENT_ID column in the EMPOYEES Tables. 
Join Condition: DEPARTMENTS.DEPARTMENT_ID = EMPLOYEES.DEPARTMENT_ID
Once we selected the empty box beside both column it will change to light grey and Join is created between those tables.

Step7: Select the following columns from the tables (by selecting the check boxes beside the column names):


-Select DEPARTMENT_NAME from the DEPARTMENTS table
-Select FIRST_NAME, LAST_NAME, HIRE_DATE, and SALARY columns from the EMPLOYEES table. Below screen is showing how to select all the columns from this two tables.
Step8: Now come to the Conditions tab. We can see the only selected Columns. Change the columns in the Alias and als type "IN (:P_DNAME) in the Condition field for the department name column, as shown in the screen below . This will define a parameter P_DNAME on the department name column.
 
Note: The IN condition is being used here for the parameter to accept All or Multiple values for the department name column.The aliases and display names can be changed in the Data Model page, either in the Diagram or in the Structure too:

Step9: Click on the SQL tab. It will show the SQL query and /click on Results to see the result for the query. 

Step10: Click Save and This will prompt you to enter a department name for the parameter, enter Sales and click OK.
Step11: Now we are coming back to 'Create Data Set - SQL' screen. We can see the window filled by SQL Query for the column which we have selected in the Query Builder and Click 'OK' with the below screen.
Step12: Once we clicked 'OK' with the above screen we will be asked for bind parameter screen. click 'OK' with the screen.
Once we clicked 'OK'  and It will give us the 'Info'. click 'OK'.
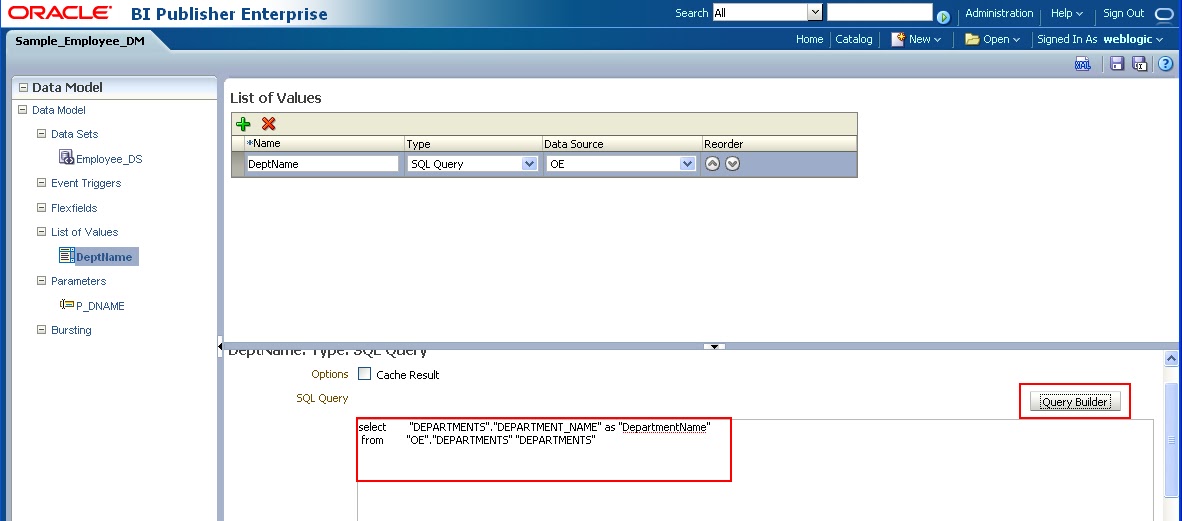
Step13: Now we can see the Data Model Screen with Employee_DS data set and p_DNAME parameter. From the window select List of Values and click '+' symbol from right side pan to create New value.
Name: DeptName
Type: SQL Query
Data Source: OE

Click 'Query Builder' and select only department name from department table form the OE schema query builder and click 'Save'
Step14: Now come to Parameters settings in Data Model.
Now we can the set the properties of P_DNAME parameter to use this LOV.
Verify the following has been entered in the box and selected. If it is not , enter the value as mentioned and select the properties as we seen in the below screenshot:

Name: P_DNAME
Data Type: String
Default Vaulue: * (The character Star) The aim is to give all the of this parameter
Paramter Type: Menu

The following this has be selected into the parameter window:
List of Values: DeptName (This is what we have created in List of Values in Data Model)
and Multiple Selection, Can select all, and All Values Passed options are selected. This options are enabling us to select all or multiple values from Department Name Parameter and Save the Data Model.
Step15: Now we are going to create Employee Name by concatenating Employee First Name and Last Name in the Emloyee_DS Data set. so Edit the Employee_DS Dataset the change the SQL Query like same shown in the below screen shot:
After that save the Data Model.
Step16: With the above step we are coming to end of creating a Data Model. Now we will see the XML output of the Data Model and we will upload the same to the sample data. (In 10g we will download the data model as xml file and we will upload the same into sample data But in 11g we can do all this work in here itself.)
Now click 'XML' option which is available near to Save Button.
Once we clicked 'XML' option with the above screen, we are coming to the below screen. From this window 'Sales' from Department Dropdown and select '10' rows in the 'Number of rows to Return' and click 'Run' Button. Now select 'Save as Sample Data' and it will be saved into sample.xml file with the above screen. Now if we are clicking on sample.xml file we can see the first ten rows of sales department.
So With this step we are completing the creation of Data Model. In the Next step We will know How to create a Report using this Data Model.

Cheers!
Bose

What is Oracle Database Link and How to create database link (DB Link)

 https://www.oracletutorial.com/oracle-administration/oracle-create-database-link/

Recent Posts